1.39 Billion Tokens, ¥197: A Two-Lens Audit of One Month of AI Usage
Headline numbers
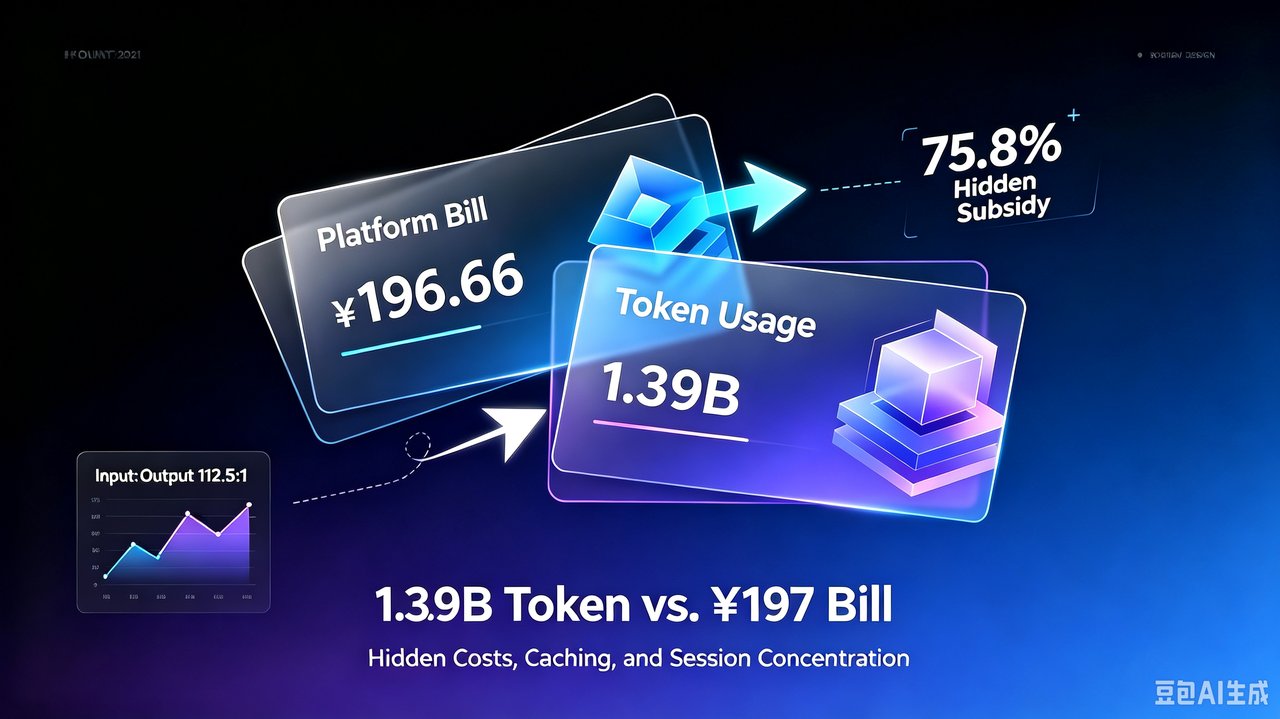
Cross-referencing “what I paid” against “what I consumed” for August 2026:
| Lens | Value |
|---|---|
| Actual spend (platform billing, converted) | ¥196.66 (3,286 requests) |
| List-price equivalent (local tokens × public rates) | ¥813.16 (1,390,620,186 tokens) |
| Hidden subsidy | ¥616.50 (75.8%) |
| Cache re-read share | 93.46% (no-discount month: ¥8,460.04) |
| Top 20 of 204 sessions’ token share | 81.2% |
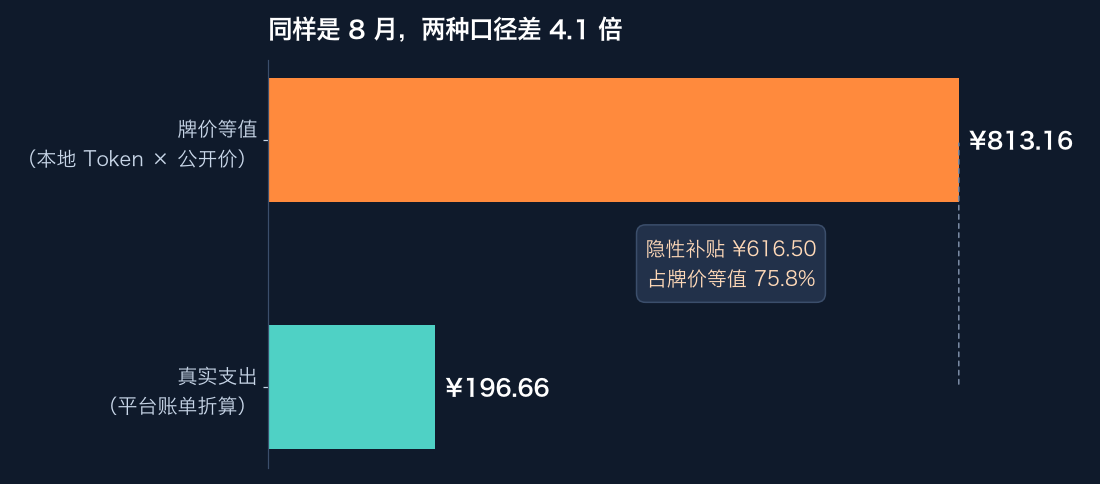
Hidden subsidy = ¥616.50 / month, or 75.8% of the list-price value. Free tokens, -free models, and the subscription quota I rotate through paid for it. Concretely: the 30.2% of tokens that ran on -free models are recorded as ¥0 on the bill, but the token report values them at their paid twin’s list price — ¥160.86 — so the compute actually consumed stays visible. That subsidy appears on no invoice, which also means it can vanish without warning. If free quotas tighten, real spend jumps from ¥197 to the ¥800+ range overnight.
Three conclusions: the two lenses must be read together; cache pricing absorbs 90.4% of context-transport cost; and usage optimization is about outliers, not habits.
Why one lens fails
My usage pattern is “rotate and harvest”: one subscription IDE per month (August: CodeBuddy, five accounts drained in turn), DeepSeek’s open platform as pay-per-token API, and free-tier models carrying the bulk of volume — 54.2% of requests and 30.2% of tokens ran on free quotas.
Three data sources, three blind spots:
| Source | It tells you | It hides |
|---|---|---|
| Platform dashboards / exports | Request counts, credits, actual charges | Token volume, per-request weight |
| Local session logs | Tokens, cache hits, model names | Actual spend |
| Vendor quota pages | Remaining quota | Whether you used it |
Two open-source skills cover the two sides: ai-usage-report pulls platform billing (CodeBuddy / Qoder / TRAE / DeepSeek); ai-token-usage parses local logs (Claude Code / OpenCode / Copilot). Once installed and authenticated, a monthly run takes about 10 minutes.
Key structural fact: the two lenses cover nearly disjoint clients — 91% of billed requests went through CodeBuddy, while 91% of measured tokens flowed through Claude Code + OpenCode. All figures below are therefore presented side by side, never summed.
Lens A: the ¥196.66 structure
| Platform | Requests | Share | Spend (conv.) | Share | Per-request |
|---|---|---|---|---|---|
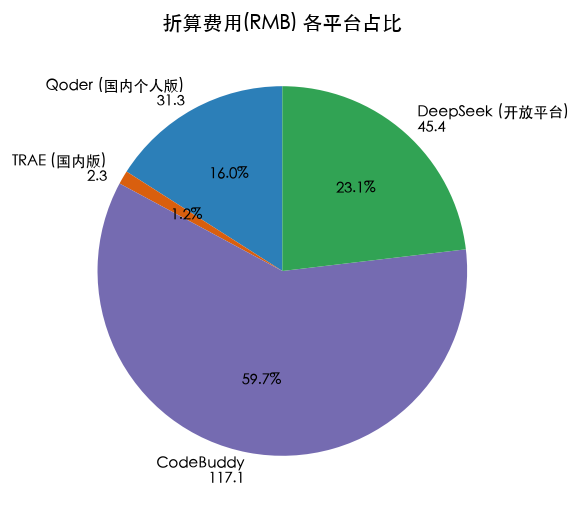
| CodeBuddy (5 accounts) | 3,002 | 91.4% | ¥117.57 | 59.8% | ¥0.039 |
| DeepSeek (API) | 108 | 3.3% | ¥45.37 | 23.1% | ¥0.420 |
| Qoder (2 accounts) | 64 | 1.9% | ¥31.30 | 15.9% | ¥0.489 |
| TRAE (2 accounts) | 112 | 3.4% | ¥2.42 | 1.2% | ¥0.022 |
| Total | 3,286 | 100% | ¥196.66 | 100% | ¥0.060 |
The asymmetry: CodeBuddy carried 91.4% of requests for 59.8% of spend; DeepSeek carried 3.3% of requests for 23.1% of spend. Free vs paid requests: 1,781 (54.2%) vs 1,505 (45.8%). Top model by requests: hy3 — 1,628 calls, entirely on free quota.
Where the money goes and where the calls go are two different distributions:
| Converted spend (RMB) share | Request-count share |
|---|---|
 |
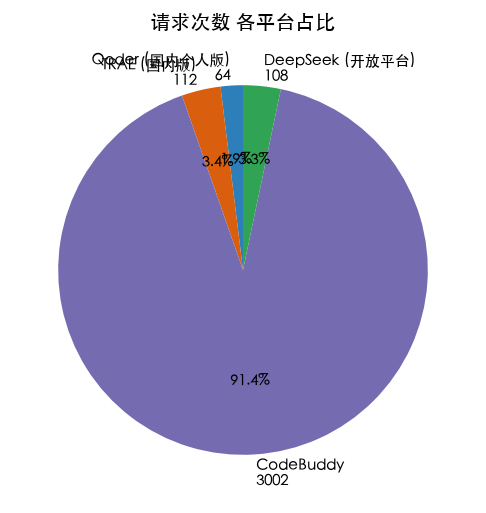 |
Look at only one of these pies and you reach the opposite conclusion.
Daily spend curve — and note the hand-off between accounts: 8/1–8/12 sits almost entirely on the main account kyxxxxab; from 8/13 the centre of gravity moves 135-08 → 138-32 → 139-32 → 136-91. That is the fingerprint of draining one subscription quota at a time:
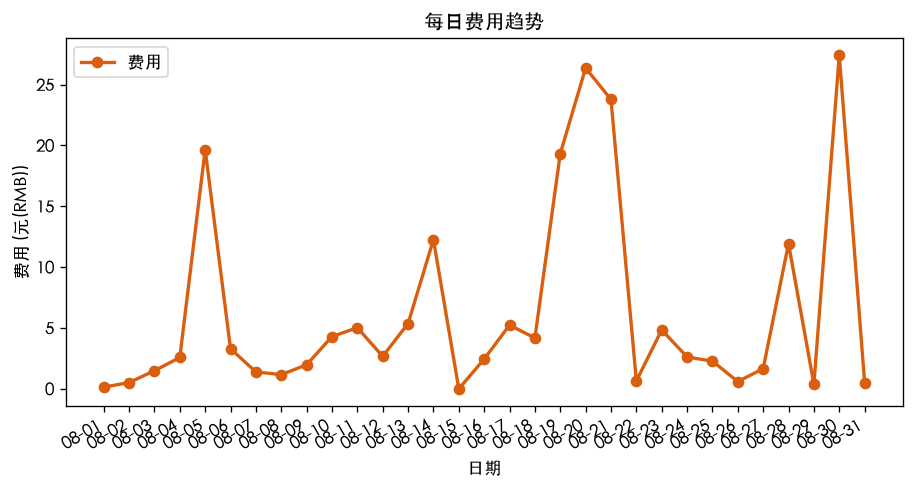
Peak days: CodeBuddy 8/20 (¥26.37) and 8/21 (¥23.60); DeepSeek 8/30 (¥24.54). Requests by model: hy3 1,628, deepseek-v4-flash 611, deepseek-v4-pro 470.
One chart in this set should NOT be trusted — the task-type distribution, where 86.9% of requests land in “other/conversation”. That is keyword classification failing on coverage, not a real distribution, and it is the cleanest argument for never trusting a single chart:
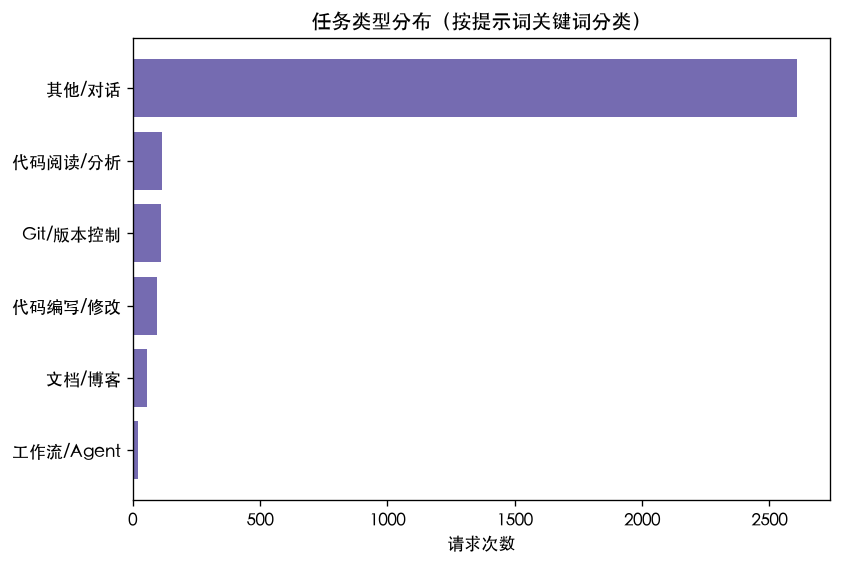
Subscription costs scale with request count toward a near-zero marginal rate; pay-per-token costs scale with context volume. Measuring AI cost by request count misleads; measuring it by tokens ignores the zero marginal cost of subscriptions. Both metrics, always.
Lens B: verifying the 93.46%
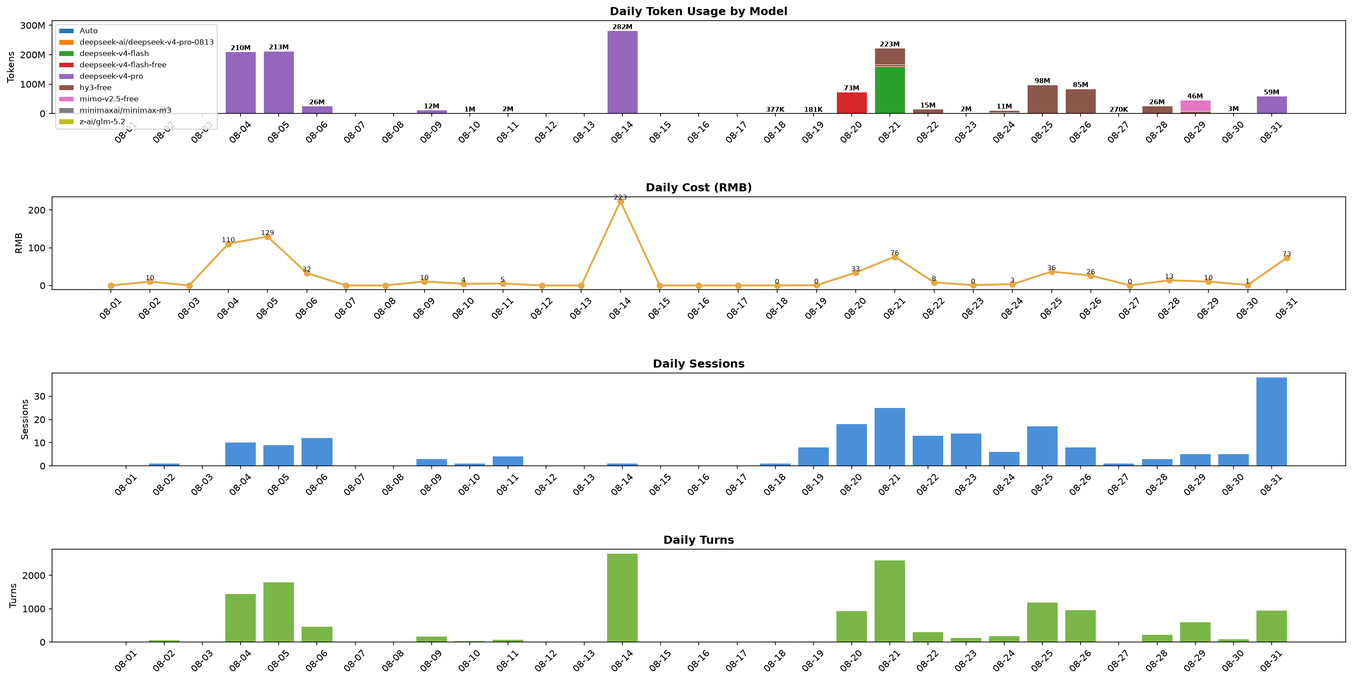
Token composition: cache re-reads 1,299,678,784 (93.46%), fresh input 78,693,336 (5.66%), output 12,248,066 (0.88%). Input : output = 112.5 : 1. 204 sessions, 14,700 turns, 22 active days.
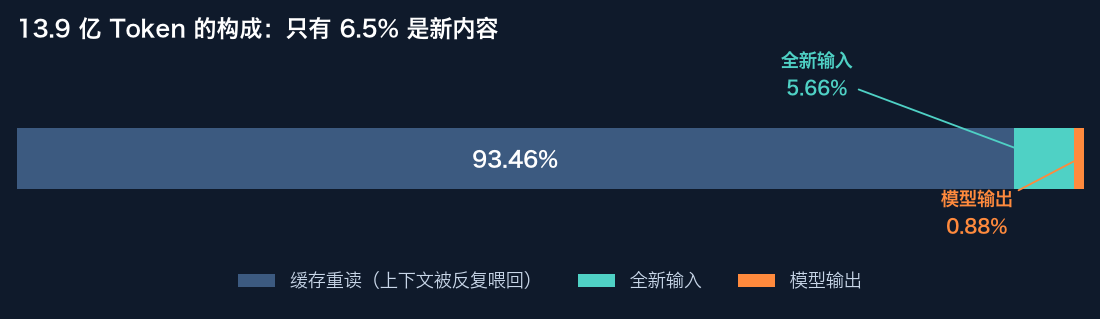
By model:
| Model | Tokens | Share | List-price equivalent | Billing |
|---|---|---|---|---|
| deepseek-v4-pro | 806,913,101 | 58.0% | ¥599.94 | paid |
| hy3-free | 299,921,169 | 21.6% | ¥115.39 | free quota |
| deepseek-v4-flash | 163,551,983 | 11.8% | ¥50.74 | paid |
| deepseek-v4-flash-free | 80,556,926 | 5.8% | ¥37.37 | free quota |
| mimo-v2.5-free | 38,773,758 | 2.8% | ¥8.10 | free quota |
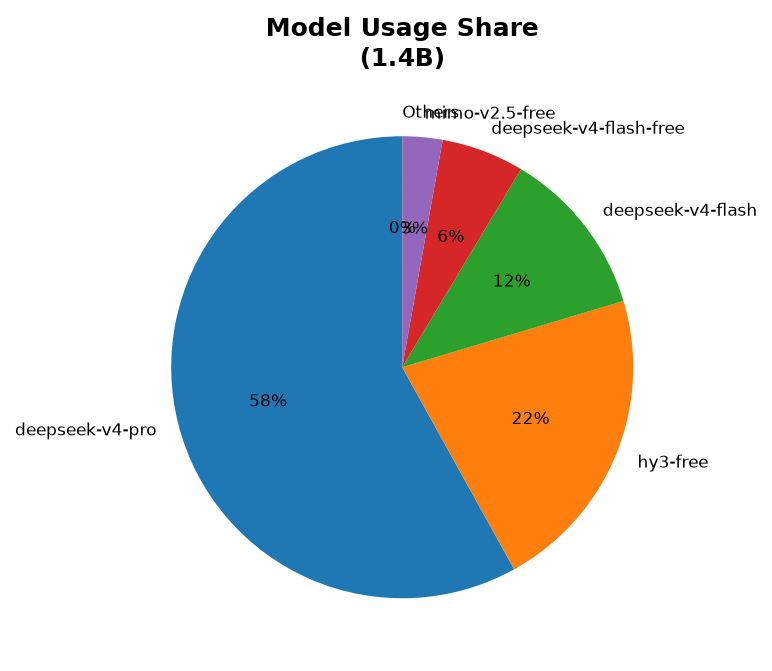
The cost column is list-price equivalent: -free models are valued at their paid twin’s list price on purpose — otherwise free usage would be invisible. Their real invoice line is ¥0.
Method: the aggregated input_tokens already folds in cache re-reads (tracked separately as cache_read_tokens), so the share is cache_read_tokens / total_tokens.
Verified three ways:
- Sum conservation — per-model cache figures sum exactly to 1,299,678,784.
- Cost reconstruction — recomputing cost from raw token counts yields $120.70 × 6.737 FX = ¥813.16, matching the report.
- Raw-log sampling — cache counters are provider-reported fields (
cache_read_input_tokensin Claude Code JSONL), not inferred.
Cache pricing (USD / 1M tokens):
| Model | input | cache_read | output | cache ÷ input | cache ÷ output |
|---|---|---|---|---|---|
| deepseek-v4-pro | $1.32 | $0.044 | $3.96 | 1/30 | 1/90 |
| deepseek-v4-flash | $0.44 | $0.014 | $1.32 | 1/31 | 1/94 |
| hy3 | $0.148 | $0.037 | $0.594 | 1/4 | 1/16 |
Counterfactual: billing those cache re-reads as standard input would cost ¥8,460.04 for the month — the cache discount saved ¥7,646.88 (90.4%). Switching tools, starting fresh sessions, or re-sending large files every turn collapses cache hits into full-price input: the same work at roughly 10x cost.
The power law of sessions
| Slice | Share of monthly tokens |
|---|---|
| Top 1 | 20.3% (281.7M tokens, 2,646 turns, Aug 14, ¥223 equivalent) |
| Top 3 | 43.0% |
| Top 10 | 66.5% |
| Top 20 | 81.2% |
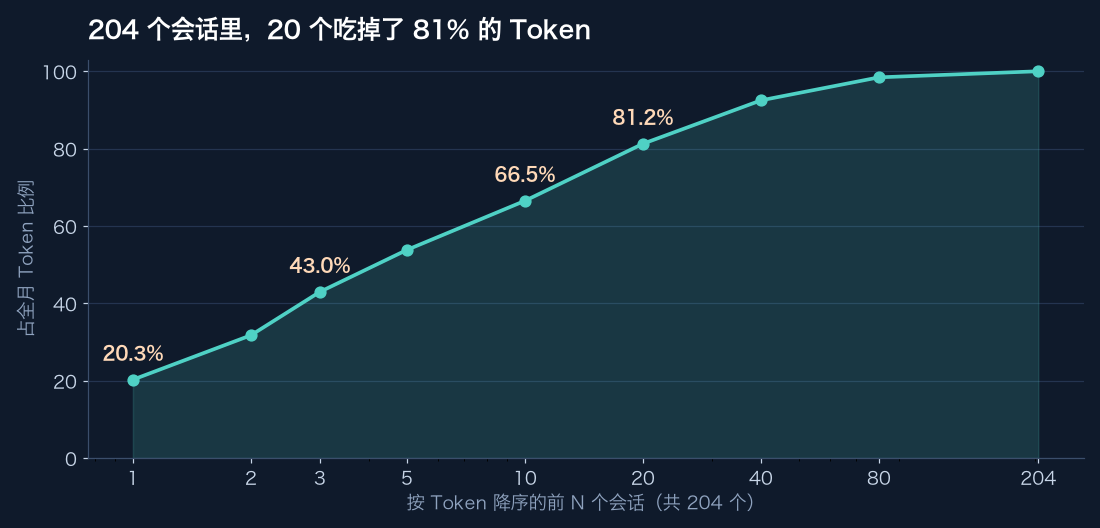
Median session: 326,570 tokens; mean: 6,816,765 — 20.9x the median. Against this distribution, “reduce average usage” is a meaningless target; auditing whether the top few sessions needed to exist moves 43–66% of the total. The single most expensive session exceeded my entire monthly bill.
The playbook
- Read both lenses side by side; never sum them.
- Route tasks by tier: high-frequency small requests → subscription IDEs (¥0.022–0.039/request); specific-model or long-context deep work → pay-per-token API (¥0.420/request); batch agent loops →
-freemodels (already carrying 30.2% of tokens). - Guard the cache-hit rate: reference large files instead of re-sending; open new sessions deliberately; record
cache_read / totalmonthly and investigate below 90%.
Data caveats
- Daily sums differ from the monthly total by 698,695 tokens — treat day-level attribution as approximate; month- and session-level figures are reliable.
- Keyword-based task classification has poor coverage (86.9% of CodeBuddy requests classified as “other/conversation”) — not usable for attribution.
- Three models were priced via fallback/substring matching (~¥1.39 total), so ¥813.16 is an estimate, not an invoice.
- Missing days on rarely-used secondary accounts are expected zeros, consistent with their activity windows.
Reproduction checklist
- Install
ai-usage-report/ai-token-usage; run eachinit.pyonce. - Export monthly bills into
data/<platform>/raw/; runnormalize.py. - For platforms without exports, run
scrape_usage.py --start <month-start> --end <month-end>. - Generate per-vendor + summary reports with
generate_reports.py. - Run the token side:
ai_token_usage.py --since <start> --until <end>. - Merge cross-machine stores with
--import-data. - Archive under
summary/<date>/on the 1st of each month for month-over-month comparison.
This post is the field-data installment of the AI Cost-Effective Usage Strategies series; the methodology lives in the previous post, “Measuring Your AI Usage and Cost.”
Both measurement skills are open source:
- GitHub: https://github.com/KylinLabAI/kylinlab.tech.skills
- Gitee (mirror): https://gitee.com/KylinLab/kylinlab.tech.skills